
Updated July 10, 2026

Portable Power & Solar Backup Statistics

A sourced reference for outage, solar, storage, and generator safety numbers in the United States.

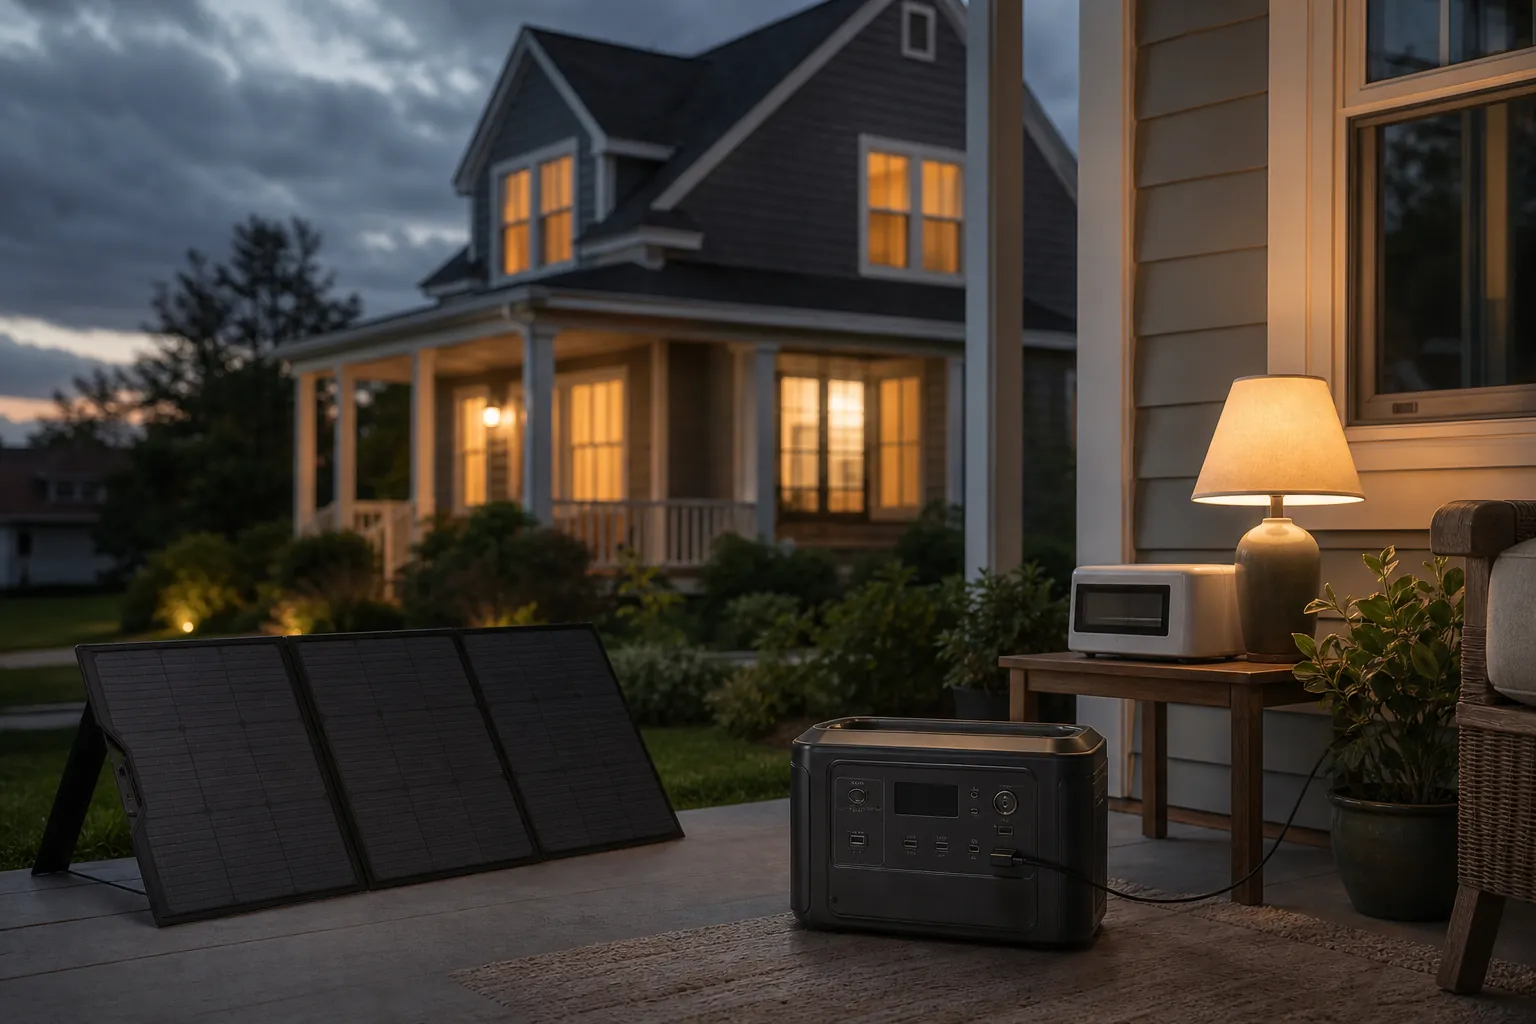
Portable solar generator and backup power gear set up during an outage
14Sourced stats
8Named sources
2026Last updated

Why these numbers matter

Outage planning has moved from a niche prepper topic into a mainstream home question. Storms, longer restoration times, solar adoption, and battery storage growth all point to the same practical need: people want backup power that is easier to understand before the lights go out.

Outages Statistics

How often U.S. customers are losing power and what caused the latest jump.

2 Stats

Weather Statistics

Why storm and disaster data matters for backup power planning.

5 Stats

Solar Statistics

How solar adoption is changing the power options available to homeowners.

3 Stats

Storage Statistics

Battery storage data that shows where backup and grid flexibility are heading.

2 Stats

Safety Statistics

Portable generator safety data to keep backup power decisions grounded.

2 Stats

Methodology & sources

This page uses public figures from government agencies, industry bodies, and named market reports. Each stat includes its source and publication date or access date. Figures are kept in their original units unless a source already presents the number in a rounded public format.

Cite this page

Suggested citation: GJB Products, "Portable Power & Solar Backup Statistics," updated July 10, 2026. Available at https://gjbbuzz.com/portable-power-statistics.

https://gjbbuzz.com/portable-power-statistics

Turn the numbers into a backup plan.

If these stats are making the case for portable power, start with the job: outage backup, camping, solar charging, outdoor lighting, or security.